Practical Tools and Wise Quotes on All Matters Creative
|
|
Practical Tools and Wise Quotes on All Matters Creative |
1.5. Causal breakdown: the Cause-Effect Diagram
How To Invent (Almost) Anything > 1. Analytic Invention > 1.5. Causal breakdown: the Cause-Effect Diagram < Prev Chapter | Next Chapter >
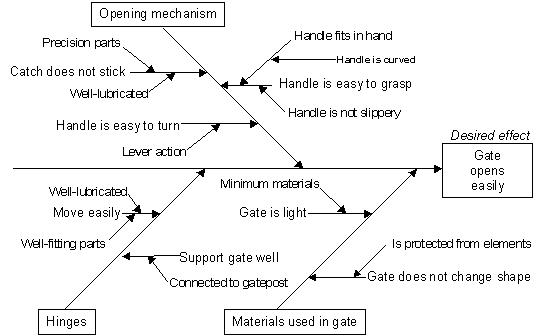
Many inventions are around causality. For example, the umbrella causes rain to be deflected from the person underneath. It also has undesirable effects, for example causing the person holding the umbrella to have tired arms, or that the ribs of the umbrella strike and hurt people nearby. By understanding causes, we can invent ways to cause desirable effects and prevent undesirable effects (and it can be argued that this is all that invention is about). A simple method of drawing out causes is the Cause-Effect diagram, also known as the Ishikawa diagram (after its inventor) or the Fishbone diagram. In essence, it simply involves chunking down, not into parts but into causes. The desired or undesired effect is placed in a box to the right, major aspects of the situation form the major ‘ribs’, then causes are added by asking ‘how or why might that happen?’ You can then select one or more causes on which to work.
Fig. 1.5 Cause-effect diagram for desired cause In the intangible area of social invention a Cause-Effect Diagram for
investigating the breakdown of marriages might have areas such as ‘relatives’,
‘work’ and ‘relationship’ and could lead to such ideas as whole-family
counselling or spouse-days at work. Other logical/analytic tools:
|
Site Menu |
|
| Tools: | All | Definition | Ideation | Selection | Implementation | |
|
| Full Book! | Articles | Quotes | Quoters | Links | Settings | |
|
| Settings: | Computer layout | Mobile layout | Small font | Medium font | Large font | Translate | |
And here's our book: |
|
|
|
|